Mapas e gráficos sobre energia e clima
| In addition to being important for human health, access to an improved water source is indicative of the state of a country's overall physical infrastructure. Access to improved water provides a buffer against climate change and variability, especially in countries which are prone to drought. Populations with access to improved water are also less at risk of contracting water borne diseases. In many countries, women are responsible for collecting water. As water sources diminish because of climate change, they will have to walk farther to collect water, leaving less time for other economic and cultural activities. | | 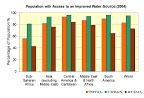 Download Figure | Data and Citation |
| Over 50 percent of all China's coal is used in the electric power industry. This electricity powers mainly industry but also households and the service sector. | | 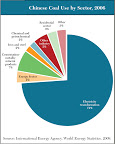 Download Figure | Data and Citation |
| Digital access is an important indicator for vulnerability and adaptive capacity to climate change because of the increasingly large role of telecommunications in all aspects of life. Digital access allows individuals and communities to access information on changing weather patterns, current events, disasters and early warning systems, as well as general information on agriculture and markets to facilitate adaptation. Digital access is also important during all phases of disaster response. A high score on the Digital Access Index suggests reduced vulnerability and increased adaptive capacity to climate change. | | 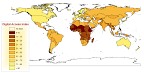 Download Figure | Data and Citation |
| In the last few years, China has become the world's leading source of greenhouse gases, especially carbon dioxide, and its emissions are growing rapidly. China now produces about one-fifth of annual global carbon dioxide emissions, just ahead of the United States. China's per capita emissions, however, are just one-quarter of U.S. levels due to its relatively large population and high rate of poverty. In 2006, for instance, the average American produced approximately 20 metric tons of carbon dioxide; the average Chinese produced just 5 metric tons. For another representation of this data, click here. | | 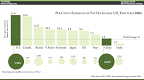 Download Figure | Data and Citation |
| Solar photovoltaic systems generate electricity using technologies that capture the energy in sunlight. Many parts of the United States—especially the Southwest—have abundant solar resources (see Figure 5, which shows estimates of the average daily total radiation for flat plate solar collectors). Before investing, however, firms should commission a thorough professional study of a specific site's solar resources. Even if it reveals lower or moderate resources, solar power could still be financially attractive, depending on financial incentives and regulatory context. Credit: National Renewable Energy Labs and WRI. | |  Download Figure | Data and Citation |
| Wind energy systems generate electricity by using turbines to capture the wind's energy. Many locations in the United States have good wind resources. Evaluating the quality of the wind resource at a specific site is critical to determining if it is suitable. Before making any investment decision, companies should commission a professional wind study, which evaluates the quality and consistency of a site's wind resource potential. Credit: National Renewable Energy Labs and WRI. | |  Download Figure | Data and Citation |
| China's National Development and Reform Commission's "Top 1,000 Enterprises Program" is central to its efforts to reduce national energy intensity by 20 percent. Established in its current form in 2006, this program imposes a significant portion of the overall 20 percent energy intensity target directly on China's 1,000 largest state-owned enterprises, most of which are in heavy industry (see figure). In 2005 the enterprises in the program accounted for at least 33 percent of total primary energy demand and 47 percent of industrial energy demand. The program met its goals in the first year, achieving the full 20 percent of its five-year target and actually exceeded its targets in 2007. | | 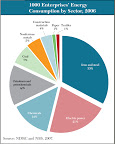 Download Figure | Data and Citation |
- Progressos No Acesso A água Potável
MDG drinking water target being met is cause for celebration"More than 3,000 children die daily from diarrhoeal diseases, and 88% of these deaths are due to poor drinking water, lack of sanitation and poor hygiene. So the news from the World Health Organisation...
- Pobreza Ou Carbono?
Tirar 18,000 pessoas da pobreza ou poupar 220,000 toneladas de CO2? Is saving CO2 emissions more important than reducing poverty? This is the question the sustainability movement has wrestled with when trying to decide whether air-freighting...
- Mais Gráficos E Mapas Earth Trends
Carbon Intensity of Steel in 2005 On average, U.S. steel production is among the least carbon-intensive in the world. This is primarily the result of the type of production process the industry employs. Nearly half of all steel in the United States...
- The Oil Intensity Of Food
THE OIL INTENSITY OF FOOD http://www.earthpolicy.org/Books/Seg/PB3ch02_ss3.htm Lester R. Brown Today we are an oil-based civilization, one that is totally dependent on a resource whose production will soon be falling. Since 1981, the quantity of oil...
- Earth Policy News
DRILLING FOR OIL IS NOT THE ANSWER Jonathan G. Dorn Background • The United States consumes nearly 21 million barrels of petroleum per day (7.5 billion barrels per year), one fourth the world total. • Of the crude oil consumed in the U.S., 66 percent...