Mais gráficos e mapas Earth Trends
| On average, U.S. steel production is among the least carbon-intensive in the world. This is primarily the result of the type of production process the industry employs. Nearly half of all steel in the United States is made in "mini mills," which use electricity to recycle scrap steel rather than starting from scratch by burning coal and coke to melt iron ore into iron. The electric arc furnaces employed by the mini mills emit one-fourth the amount of CO2 per ton of steel as the blast furnaces and basic oxygen furnaces used in integrated mills if only direct emissions from the factory are counted. If one includes the CO2 emitted to produce the electricity an electric arc furnace consumes, the embedded carbon increases (though still less than that from an integrated mill, especially if that electricity is generated from low-carbon fuel sources). | 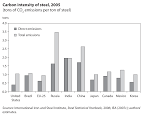 Download Figure | Data and Citation |
| GHG emissions associated with manufacturing and construction industries represent approximately one-fifth of global greenhouse gas emissions. This chart shows industry-related CO2 emissions of the 25 top emitting countries (including the EU-27), in both absolute and per capita terms. Together, these countries account for 84 percent of global emissions from this sector. | 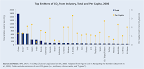 Download Figure | Data and Citation |
| One option for containing costs for carbon-intensive manufacturing industries in climate legislation is to exclude them altogether from the list of regulated entities. At less than 6 percent of total U.S. emissions, carving out this sector of the economy may seem like an acceptable sacrifice if it alleviates enough concern about industrial competitiveness to win support for broader climate legislation. However, carveouts in U.S. policy create incentives for major trading partners to follow suit. While only 11 percent of the U.S. total, direct emissions from manufacturing account for 31 percent of all emissions in China. If indirect emissions are included, manufacturing accounts for two-thirds of the CO2 China emits. Therefore, if carveouts are selected as a policy option, then an alternative regime, such as an international sectoral agreement, should cover industries excluded from a domestic cap-and-trade or carbon tax system, rather than exempting them altogether. | 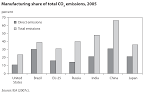 Download Figure | Data and Citation |
| In 2008, China's National Development and Reform Commission adopted a standard requiring all new coal-fired power plants to be state-of-the-art commercially available or better technology. As a result, today most of the world's most efficient (supercritical and ultra-supercritical) coal-fired power plants are being built in China. | 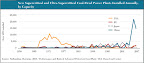 Download Figure | Data and Citation |
| Nearly 40 billion gallons are withdrawn each day from Southeast freshwater supplies for thermoelectric power plants (about 65 percent of all withdrawals). To put this in perspective, this is nearly equal to the total daily freshwater withdrawals for public supply across the entire United States. This water is needed for cooling purposes at power plants that use coal, oil, gas, nuclear, or biomass fuels to generate heat and produce electricity. Depending on the cooling methods, a portion of this water is consumed (lost to the atmosphere through evaporation). Over the course of a year, thermoelectric power plants in the Southeast consume nearly 140 billion gallons as a result of evaporation losses—equal to the annual water use of more than 1 million homes. | 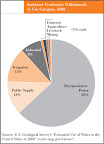 Download Figure | Data and Citation |
- Emissão De Dióxido De Carbono Pelo Mundo
...
- Reservas De Gás Natural
Fonte: The Economist "Around 45% of the world’s recoverable natural-gas reserves are "unconventional", comprised mainly of shale gas, and also tight gas and coal-bed methane. The International Energy Agency (IEA) reckons global gas demand will increase...
- Mapas E Gráficos Sobre Energia E Clima
Population with Access to an Improved Water Source in 2004 In addition to being important for human health, access to an improved water source is indicative of the state of a country's overall physical infrastructure. Access to improved water...
- The Oil Intensity Of Food
THE OIL INTENSITY OF FOOD http://www.earthpolicy.org/Books/Seg/PB3ch02_ss3.htm Lester R. Brown Today we are an oil-based civilization, one that is totally dependent on a resource whose production will soon be falling. Since 1981, the quantity of oil...
- Earth Policy News
DRILLING FOR OIL IS NOT THE ANSWER Jonathan G. Dorn Background • The United States consumes nearly 21 million barrels of petroleum per day (7.5 billion barrels per year), one fourth the world total. • Of the crude oil consumed in the U.S., 66 percent...