Clima e Energia
| This chart is a reproduction of a chart from Edison Electric Institute (EEI) that has been used to suggest that EPA's regulatory timeline is unworkable - see http://www.eei.org/meetings/Meeting%20Documents/EPA-CAAUtilityRegTimelin.... WRI has identified four categories of EPA activities on the EEI timeline that are potentially misleading: (Blue X's) Rules that have been remanded or vacated by court decisions that do not impose compliance obligations. | 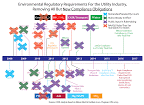 Download Figure | Data and Citation |
| Steel production accounted for nearly 17 percent of China's primary energy use in 2008. Compared to developed countries' steel producers, China's steel sector has much higher primary energy intensity. This higher intensity can be explained by heavy reliance on coal, relatively higher iron alloy production, lower waste energy recovery, smaller scale of equipment, lower conversion efficiency of steam and oxygen, and relatively poor material quality (Huang 2008; Tsinghua Study 2009). | 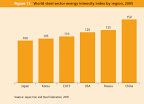 Download Figure | Data and Citation |
| A majority of turbines erected in China are small, with 600–850 kW turbines accounting for 80 percent of the market share. In 2006 the average size of turbines in China was 830 kW, compared to 1634 kW in Germany, 1634 kW in the United States, and 1100 kW in Spain. Today, the United States is developing 10 MW turbines, while China just tested 3 MW turbines. | 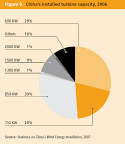 Download Figure | Data and Citation |
| Due to constant technological improvement as well as enabling policies, worldwide installed wind power capacity has risen rapidly, from about 14 GW in 1999 to 158 GW in 2009, of which the United States and Germany accounted for approximately 41 percent. The 158 GW installed capacity was estimated to generate 340 terawatthours (TWh) electricity and save 204 million tons of CO2 in 2009 (Sawyer 2010). |  Download Figure | Data and Citation |
| Coal consistently contributes to over 75 percent of electricity in China (China Bureau of Statistics 2009). To meet its ever growing demands for electricity, China has seen rapid growth of coal-fired power generation. From 2003 to 2009 the country more than doubled its coal-fired generation capacity, making its fleet the largest in the world. However, the fuel consumption per unit of electricity generated during this period has steadily decreased. The use of supercritical/ultrasupercritical technology has significantly contributed to the improvement of energy efficiency. | 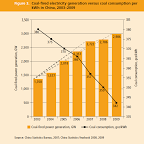 Download Figure | Data and Citation |
Regulatory Compliance Obligations For the Utility Industry
| This chart is an adaptation based upon an original chart from Edison Electric Institute (EEI) - see http://www.eei.org/meetings/Meeting%20Documents/EPA-CAAUtilityRegTimelin.... The original EEI chart has been used to suggest that EPA's regulatory timeline is unworkable. However, as illustrated in http://www.earthtrendsdelivered.org/node/406, the original chart consists mostly of procedural events and activities that will not impose a direct compliance obligation on power plants. This chart shows a more accurate picture of the timeline for new requirements applicable to electric power plants. | 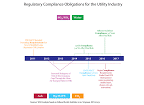 Download Figure | Data and Citation |
| In the past two decades China has emerged from a technology importer to a major manufacturer of a number of low-carbon technologies. China's government R&D appropriations have increased dramatically, from 43.9 billion Yuan (US$6.8 billion) in 1998 to 254 billion Yuan (US$39 billion) in 2008. Accordingly, three other measures—gross R&D expenditure, R&D intensity, and government science and technology (S&T) appropriations—have also enjoyed rapid growth. | 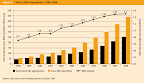 Download Figure | Data and Citation |
- China Compra Parte Da Ucrânia?
"While China's population consumes 20% of the world's food supply, its arable land constitutes only 9% of the world's farmland. This disparity, caused by the nation's rapid industrialization and population growth, leads to a higher demand...
- Reservas De Gás Natural
Fonte: The Economist "Around 45% of the world’s recoverable natural-gas reserves are "unconventional", comprised mainly of shale gas, and also tight gas and coal-bed methane. The International Energy Agency (IEA) reckons global gas demand will increase...
- Mapas E Gráficos Sobre Energia E Clima
Population with Access to an Improved Water Source in 2004 In addition to being important for human health, access to an improved water source is indicative of the state of a country's overall physical infrastructure. Access to improved water...
- The Oil Intensity Of Food
THE OIL INTENSITY OF FOOD http://www.earthpolicy.org/Books/Seg/PB3ch02_ss3.htm Lester R. Brown Today we are an oil-based civilization, one that is totally dependent on a resource whose production will soon be falling. Since 1981, the quantity of oil...
- Earth Policy News
DRILLING FOR OIL IS NOT THE ANSWER Jonathan G. Dorn Background • The United States consumes nearly 21 million barrels of petroleum per day (7.5 billion barrels per year), one fourth the world total. • Of the crude oil consumed in the U.S., 66 percent...